


Excel can only plot data values from tables. The tables can be horizontal or vertical, and may contain multiple data sets. This mean that to graph any data set or any function, the information must first be inserted or generated in tabular form. Once a table of data exists, the plotting of the data is straightforward.
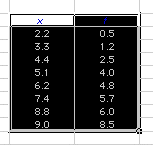
Step -1. Select the data (table) to be plotted.
Step 0. Select the Chart Wizard Tool from the menu bar.
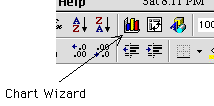
The Chart Wizard dialog box will appear; 4 steps remain to be done.
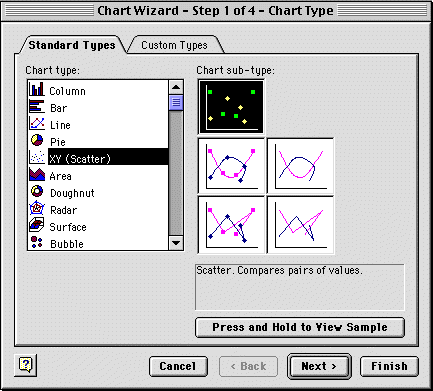
Step 1. Select the "Chart Type". We will often use the line graph
or the XY-scatter mode in these notes. The XY-scatter mode must be
chosen when the data is not ordered in "x". The XY-scatter
mode is selected below. The subtype will be chosen as line with
dots.
-- Press "Next".
Step 2. Select the "Source of Data". This is automatically done
by the table selection. However, note that Excel might default to the row
number for the "x" axis in a XY plot (for business purposes where the
row number might be the month number). To use the first data column
to specify the "x" axis values, use the series option and "delete"
the first column (x) from the data series.
-- Press "Next"
Step 5. Select the "Chart Options". The important ones are the Chart Title, the X and Y labels, and the legend. Fill in the required fields.
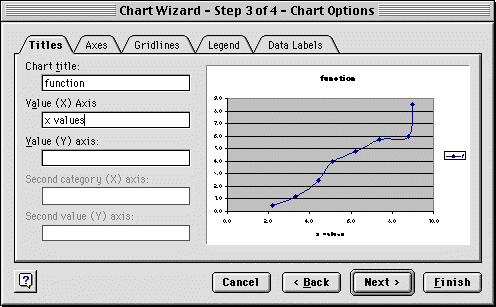
-- Press "Next"
Step 4. Select the "Chart Location". The choices are on a "New Sheet" or as an object in the current spreadsheet (one of the sheet in the workbook).
The Chart is now finished. The location and size of the graph can now be adjusted to fit within the worksheet.
The final result for our trial table of data is shown below.
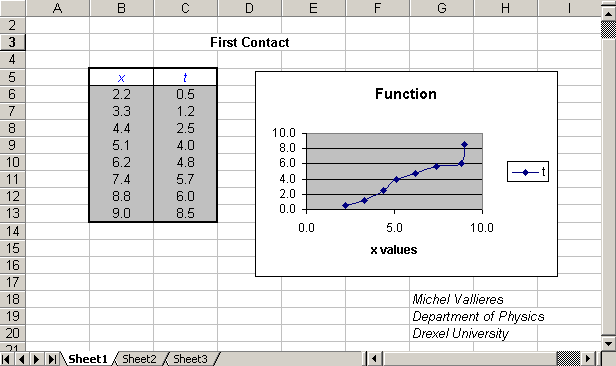
The Chart Wizard Tool is simple and intuitive; yet it offers the Excel user many options at every step of the way. Much practice is needed here to familiarize oneself with the very many plotting styles that Excel offers. Each has advantages and disadvantages in addition to their esthetic values which the user should explore.
|
Any questions or suggestions should be directed to |