Plotting with Gnuplot
Overview
Graphical display is an essential part of visualizing, analysing, and
presenting scientific results. We present some basic techniques for
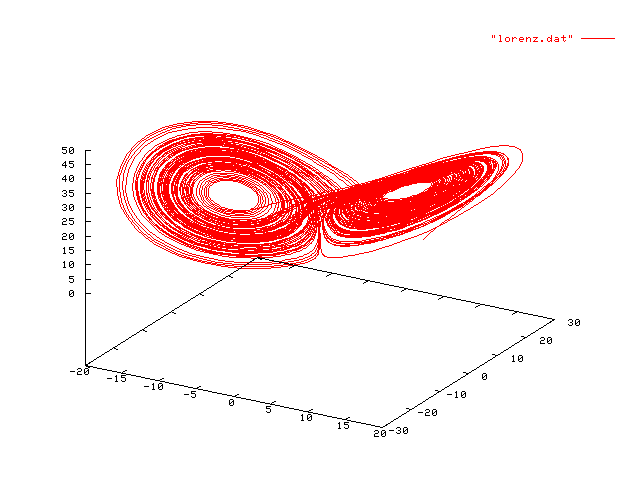
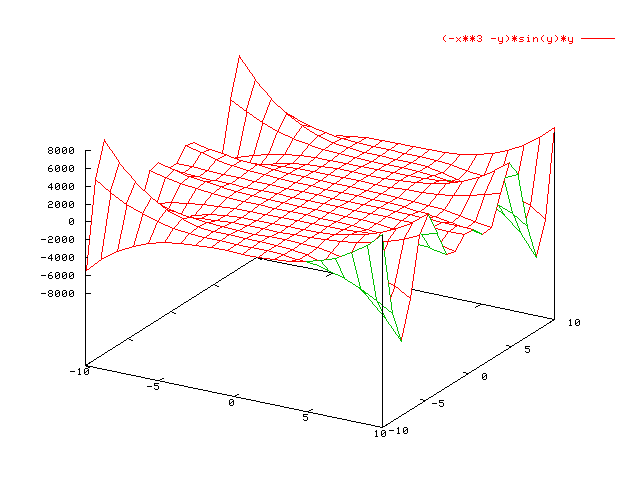
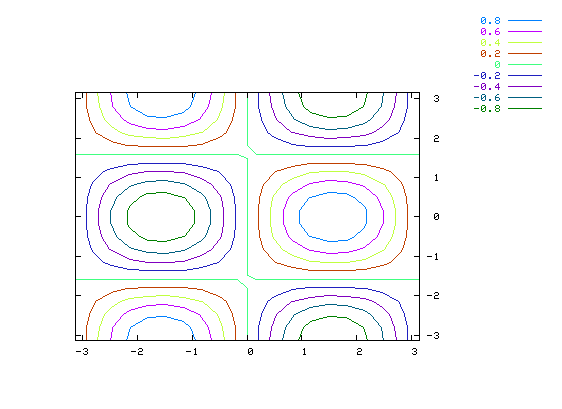
turning the output of your program into 2-D and 3-D plots, images, and
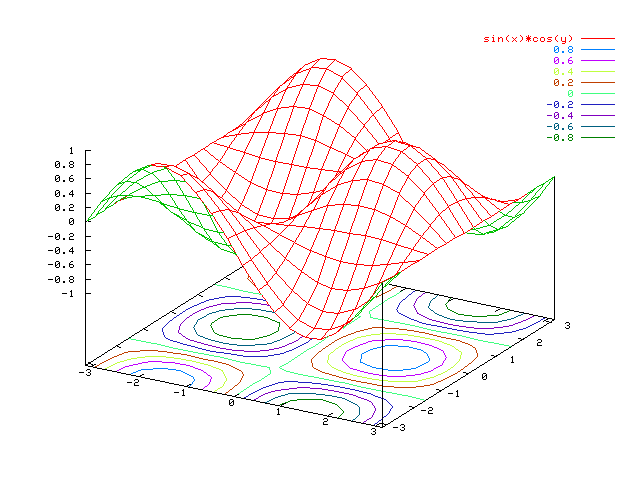
movies. Specifically, we discuss the gnuplot graphics package, which
will allow you to produce high-quality plots with minimal effort, and
save them in a form suitable for printing or inclusion in printed
documents. A helpful tutorial on gnuplot may be found here; the full (long!)
gnuplot manual is here.
Outline
- Presenting data
- Some basic requirements for a
plotting package
- What data format should we use? Exercise: making datafiles.
- Introduction to gnuplot
- An application from the Graduate workshop: fw.c.
Save the output of this program in a file --
fw.dat, say -- then run gnuplot with the command
plot [0:1.5] [0:1.2] "fw.dat"
to see the convergence of the bisection procedure. Or use
gnuplot's index feature to see specific iterations:
plot [0:1.5] [0:1.2] "fw.dat" index 5:8
- The gpl script