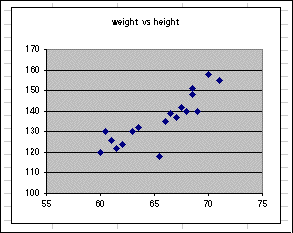


Typical data sets are noisy. These data points do not lie on smooth curves, but are spread over some interval in the y-direction. The purpose of the linear regression or straight line fit is to find the straight line which fits the data set best. The straight line equation is
![]()
So the problem is to find values for the slope "m" and intercept "b" which produce the best fitting line for a given data set. For instance, the data set weight_data will be used below to illustrate the steps in using Excel to perform this fit.

Excel has a built-in procedure to perform this fit. It is called "trendline". It can be called directly from the graph.
![]()
Upon calling "trendline", a window appears offering a choice of fitting functions. The linear fit is among these options.
This dialog window also offers to display the fitted function on the graph. You should select this option.
It also offers the option to display the statistics of the fit (which is to be shown in a separate sheet), namely some measure of the goodness of the fit.
![]()
The "trendline" procedure allows to fit data with functions of more complicated forms than straight line. Therefore Excel harbors many built-in "trendline" functions. Fitting data with complicated functions is often needed.
An interesting exercise follows from fitting the same aebitrary data set with with a few of the "trendline" options and compare to the same fit in Maple.
|
Any questions or suggestions should be directed to |