One of the first step among the final steps toward having a presentable spreadsheet is to un-clutter the spreadsheet. To this end, the graphs are easy to scale and move by simple selection with the mouse (clicking on the graph) and using the "handles" to either scale or move the graphs.
The tables are also easy to move:
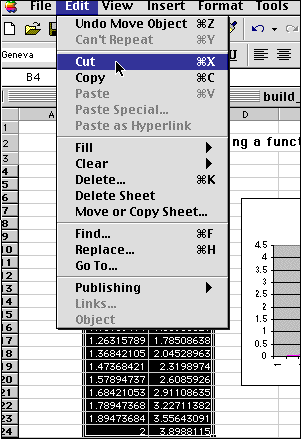
- Select the area to move- Select the "edit" - "cut" option from the menu bar
- Position the cursor in the cell of the upper-left most cell of the new area
- Hit the enter key, and the table will be copied to its new location, with no lost in the links

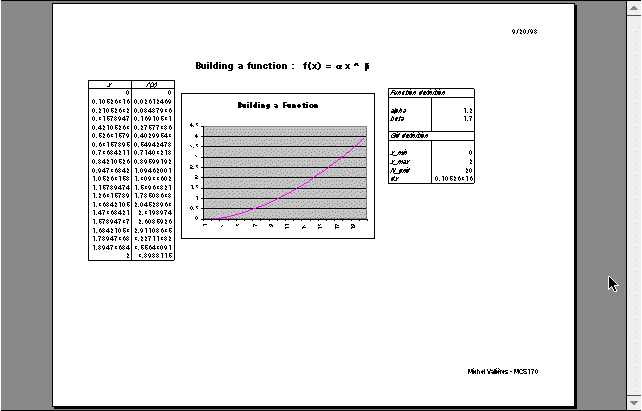
What remains to do is to improve the style & appearance of the final spreadsheet. For instance, borders could be added to the tables. Next, the "Print Setup" and the "Print Preview" options are used to adjust the printing style (portrait or landscape), judge the best positions of tables and graphs for a proper look, and to adjust the header and footer of the final print.
Here is the final look of the spreadsheet from "Print Preview".

|
Any questions or suggestions should be directed to |